
Identifying 64-bit PE Entry Points in IDA and x64dbg
EKGSEC October 29, 2023 Articlestd::cout << “PE Entry Points are not the same as Main!” << std::endl;
Analyzing executables starts with a (what should be) a fairly straightforward process: Identifying the entry point for the program. This is where you can begin to understand the purpose and functionality of the program. In my own analysis, I often struggled to properly identify the entry point for an executable program while debugging because the initial breakpoint (Entry Point) is not actually main().
ForLoop64.cpp
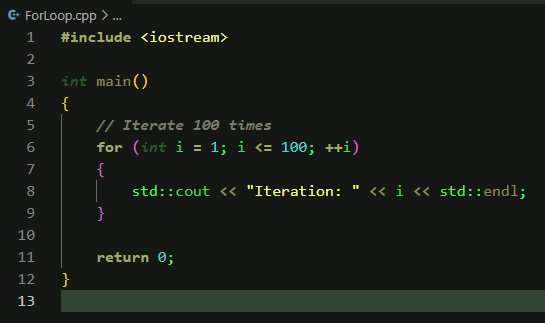
For the purposes of this post, I’ve written a simple C++ program that we will analyze in IDA and x64dbg. It consists of a “For Loop” and writes output for each iteration through the loop. The program performs the following:
- The program begins by assigning the value “1” to the “i” variable
- As a conditional statement, I’ve set that while “i” is less than or equal to 100, increment “i” by 1.
- For each iteration, output is displayed to the screen, informing of each value that “i” contains as the loop continues
- The loop will end once “i” is equal to 100.
Using IDA to differentiate between mainCRTStartup and main()
When you load an executable into IDA, it will automatically bring you to the main() function. The reason why is because it automatically skips much of the “setup” functions that the compiler has completed. Depending on the compiler, you will see extra code before main().
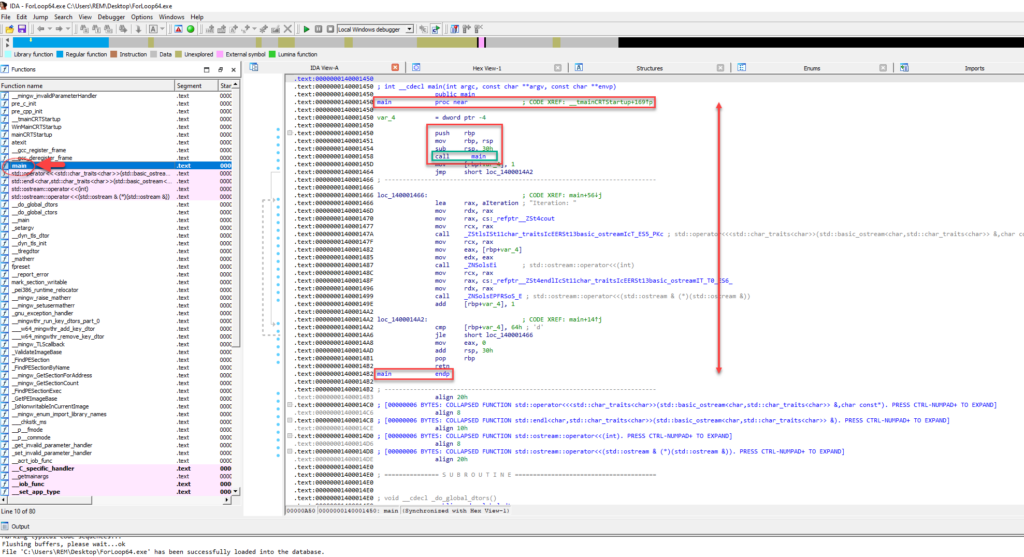
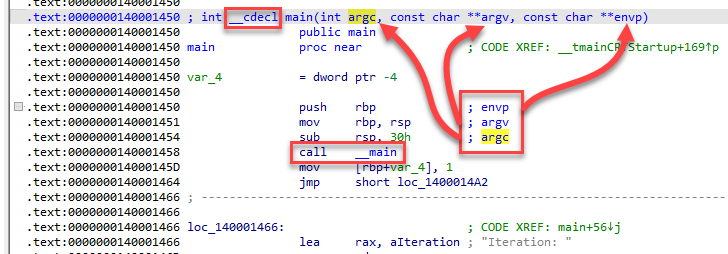
In the image above, you can see that the main() function is marked, including the arguments that are pushed to it before it is called. We will go into more detail as to what these arguments are later on. The assembly displayed within IDA is the entirety of our main() function, which includes loop iteration and the displayed output.
What about mainCRTStartup?
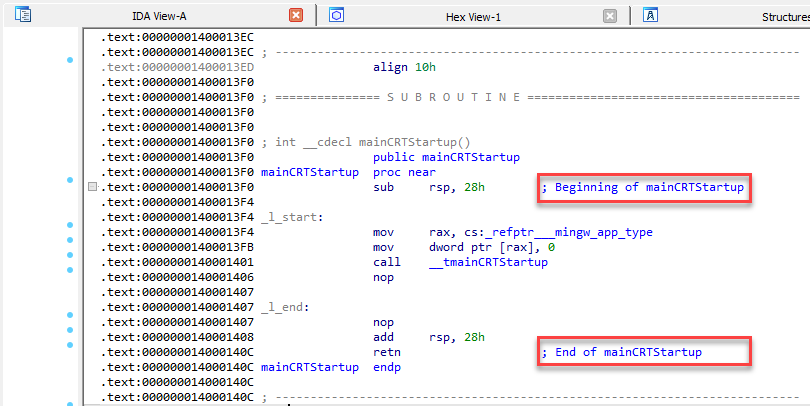
As mentioned previously, there is additional code that is generated by the compiler. In our case, one of these functions is “mainCRTStartup”, which is the entry point for the C runtime library for console applications. The alternative for GUI applications is “WinMainCRTStartup”.
In order to locate mainCRTStartup, I’ll go to the “Exports” view in IDA.

Once the function has been opened, we can see the function setup and what it entails. This is part of the compilation process and is not truly the “entry point” as we would understand it to be. The code used in this portion of the executable is repeated depending on the compiler and can be used in Yara rules to determine what type of compiler was used.
Additional Compiler Subroutines
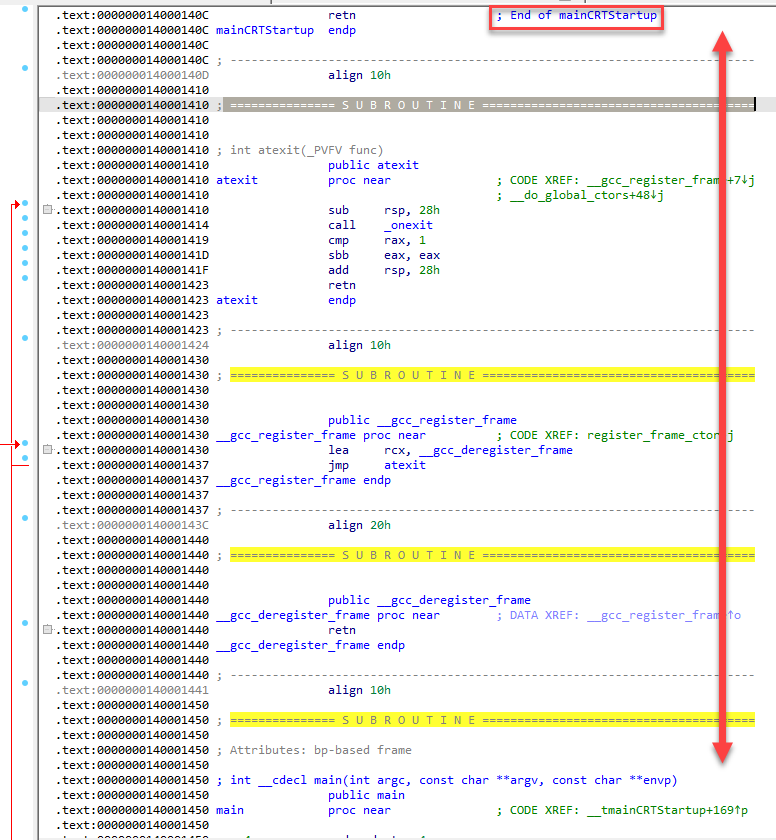
Additional code is created by the compiler in the form of multiple subroutines. These data points can be used for further identification as needed, but generally are not useful for analysis.
Identifying main() using the __cdecl calling function
Now that we have identified the end of the compiler subroutines, we can proceed to our main() function as a boundary. __cdecl is the default calling convention for C/C++ programs. The function call to main contains 3 arguments before the CALL to main().
Note: This structure can be used in obfuscated code to identify main() if the program uses __cdecl as the calling convention
Using x64dbg to differentiate between mainCRTStartup and main()
When you open the program in x64dbg, the debugger will launch the program and will pause at (what it perceives to be) the entry point. This is clearly marked as “EntryPoint” and is the only breakpoint in the debugger, where the current RIP instruction is positioned at. As mentioned previously, this is where I often was confused when I would look at the program in IDA and in x64dbg because the Entry Point that the debugger points to is actually the beginning of mainCRTStartup, not main().
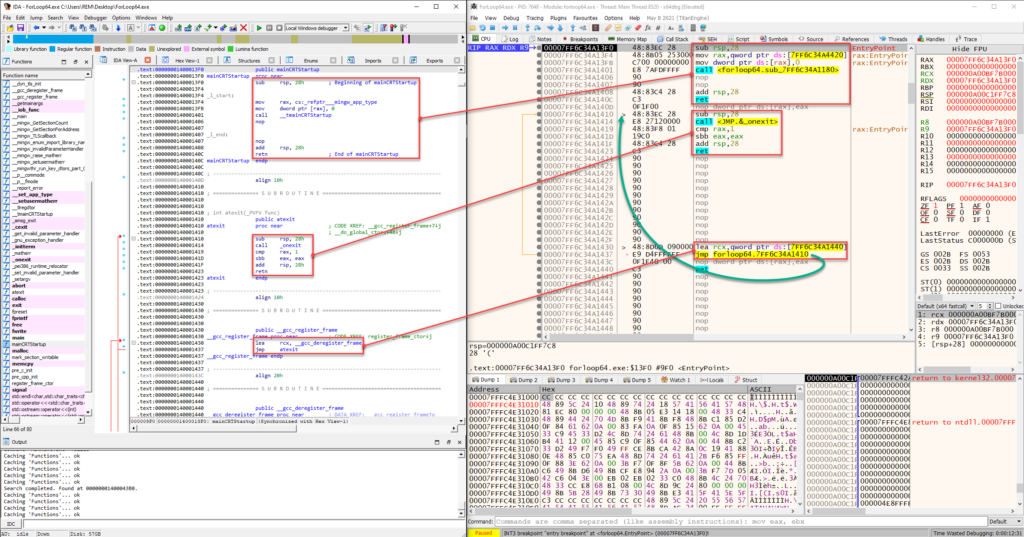
In the example above, I’ve opened both IDA and x64dbg to compare what you will see in x64dbg (right) and what you will see in IDA (left). The image shows multiple subroutines that are created by the compiler during compilation, and do not signify the main() function. You can continue down in both programs to reach the main() function call.
Identifying main() in IDA and x64dbg
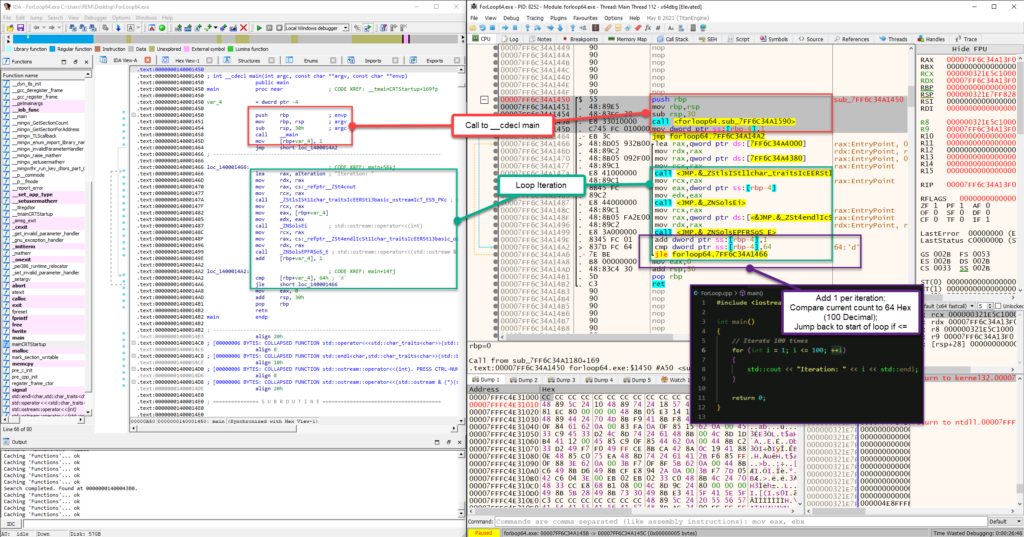
Once you reach the main() function in IDA, we can begin to compare what we see in x64dbg to properly identify main(). As mentioned earlier, you can use the __cdecl calling function to identify the arugments that are passed when main() is called. This is clearly denoted in x64dbg.

Circling around to our program logic, we can now conclude that once main() is called, we will proceed to the function contents and it will begin iterating through the “For Loop”. Using both IDA and x64dbg, you can now see the assembly that is used when the loop iterates each time until the number 100 is reached.
Archives
Calendar
| M | T | W | T | F | S | S |
|---|---|---|---|---|---|---|
| 1 | 2 | 3 | 4 | 5 | 6 | |
| 7 | 8 | 9 | 10 | 11 | 12 | 13 |
| 14 | 15 | 16 | 17 | 18 | 19 | 20 |
| 21 | 22 | 23 | 24 | 25 | 26 | 27 |
| 28 | 29 | 30 | ||||
Leave a Reply